Our Statistical Approach
How we can attach numbers to dreams
We analyze all of our results in terms of percentages and rates for two important reasons:
- First, dream reports can vary greatly in length from person to person and group to group, and even from dream to dream for one person. For example, reports submitted by women usually are about six to eight percent longer than those written by males. Since there is the possibility that there will be more of everything when reports are longer, we must have a way to correct for report length if there is going to be any regularity to our findings.
- Second, differing frequencies of one element leads to the possibility of higher or lower frequencies for other elements. For example, the number of people in a dream is probably going to be connected to the number of social interactions with people. And women in general report more people and more social interactions in their dreams than men do, even if their dreams' slightly greater length is corrected for. Thus, we once again need a way to correct for differences in raw frequencies.
The way we make these corrections is to use percentages and rates. If we simply determine what percentage of human characters are men or women, or what percentage of social interactions are aggressions, we have made a correction that makes raw frequencies irrelevant. Similarly, we can determine rates of aggressive, friendly, or sexual interactions by dividing the total number of each social interaction by the total number of characters, which in effect gives us a rate of aggression, friendly, or sexual interactions per character.
Here's a concrete example of how percentages help us: the "animal percent" indicator. In order to determine if a person or group has more animals than usual in their dreams, we can't simply count the number of animals because their dream reports may be longer than usual, or there may be more living creatures in general in their dreams (i.e., more animals and more people). We could divide the number of animals by the number of lines in the dream reports, and derive a mean score, but that gets us into the problem of some people being wordier than others. Besides, means don't lend themselves to the simple and clear analyses we can do with percentages.
So, what we do for every person or group is to divide the total number of animals by the total number of characters (animals plus people), and this gives us the animal percent. Thus, no matter how long or short the reports may be, or whatever the density of animals and people in reports of the same length, the animal percent corrects for these differences. Moreover, it turns out to be an interesting indicator that we all can grasp at a glance because we are so familiar with percentages. For example, it is much higher with children than with adults, as we might expect, and for hunting-and-gathering societies than for Americans, which also comes as no surprise, but both findings give us a sense that our indicators connect to meaningful differences in the real world.
There is a third reason for using percentages that relates to the level of measurement. We only have a nominal level of measurement, meaning that we work with frequencies based on the presence or absence of any element. With nominal data, percentages are one of the few options available -- but a very fine option for our purposes, as we shall now show. Our necessities turn out to be an unexpected virtue because percentages lend themselves to an array of outcomes that are equivalent to other statistical tests with two samples and have the added advantage of being very clear to the non-statistical reader.
The statistic we begin with to determine statistical significance is the test for differences between two independent proportions, and the number it yields is a Z score. (Proportions, of course, are the same as percentages except the percentage has been divided by 100 to create the decimal point; e.g., 68% = 0.68.) The power and simplicity of this statistical test for our purposes can be seen in the following brief overview of a more lengthy argument (the lengthy version can be found in Appendix D of Domhoff's book, The Quantitative Study of Dreams).
-
First, for those who think we should derive mean scores, it is important to realize that a percentage is merely a type of mean where all the values in the distribution of scores are either zero or one. Thus, the same inferential procedures are involved with proportions as with means in general, so there is no advantage for our purposes in determining means.
-
Second, when we are comparing two groups on the presence or absence of nominal variables, which generates a 2 x 2 table, then the results with a proportion test are exactly the same as they would be for a better known and more widely used statistic, chi square. Specifically, Z is the square root of chi squared. Here, a quick example may be useful. Consider this table displaying the normative difference between male and female dreamers on what we call the "familiarity percent," which is the percent of all human characters known to the dreamer:
|
Male Dreamers
N (%) |
Female Dreamers
N (%) |
| Familiar Characters | 501 (45%) | 796 (58%) |
| Unfamiliar Characters | 607 (55%) | 567 (42%) |
Usually, this 2 x 2 table would be analyzed with chi square statistics, but all the table really does, in effect, is to display both the "familiarity" and "unfamiliarity" percents. So, even though we often display our results in 2 x 2 tables, we do not need to employ chi square.
-
Third, percentage differences between two samples are interesting and powerful because they can be thought of in correlational terms. In fact, the percentage difference between two samples is exactly equal to the Pearson r between two samples. So, in the example we just used with familiarity percent, we can say there is a correlation of .13 between the familiarity percent and being a woman, or -.13 between the familiarity percent and being a man.
-
Fourth, it turns out that two of the statistics for determining the magnitude of a difference (the effect size) are exactly equal to the difference between the percentages in the top row of a 2 x 2 table. That is, r="phi=lambda." In other words, by sticking with percentages we can know the correlation coefficient and the effect size at a glance.
As an added bonus for using percentages, we can use a mathematically transformed version of the percentage differences between a new dream sample and our norms to create what we call the "h profile," which is a bar graphic display of all differences from the norms. Here's the h profile for males when they are compared with our female norms:
| h-profile of male dreamers compared to female dreamers |
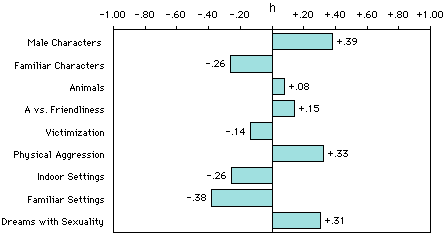 |
We have to transform percentage differences into h scores because percentage differences at the extremes (e.g., 15% vs. 10% or 95% vs. 90%) have somewhat more importance than differences in the middle (e.g., 50% vs. 45%), due to the fact that the standard deviations of the sampling distributions depend upon their population parameters, which are unknown with a percentage distribution. The nonlinear arcsine transformation that needs to be made can be done with a simple table. It is also built into our DreamSAT spreadsheet, or you can download a simple Excel spreadsheet from this page which can calculate h for you: h_calculator.xlsx
|
As a demonstration, let's find the h difference between men and women on
familiarity percent. The male normative percentage is 45%, which corresponds
to x=1.471 in the percentage
table. For women, 58% corresponds to x=1.731. So, compared to
women, men's h score is -.26, which you can see in the h-profile above.
After determining h, you can use a second table to determine the statistical significance of the difference. No formulas are needed if both samples are the same size. If the samples are not equal, you need to find an adjusted N, known as N'. This is not a straight arithmetic mean, but you can find it with this simple formula:
N' = (2*n1*n2) / (n1+n2)
In our 2 x 2 familiarity example, N' = 1222. The confidence table shows that with an N' of 1222, we need an h score of about .11 to achieve statistical significance at the p=.01 level.
|
There is, of course, a little more that could be said about each of these statistics. The details and supporting references can be found in Appendix D of Bill Domhoff's book, Finding Meaning in Dreams: A Quantitative Approach (Plenum Publishing Co., 1996). You can also see some more h-profiles in the Findings section of this Web site.
In summary, percentages are an excellent statistic for use with nominal data -- which is all we really have -- and a necessity for us in any case because of our need to correct for dream length. Once we are forced to use percentages because of the nature of our data, they turn out to be a godsend because we can in effect derive chi square, Pearson r, and two effect size statistics from percentage differences while relying only on a simple test for the significance of differences between two independent proportions. Moreover, the results for this test can be derived from a table, a formula, or a spreadsheet. We can't imagine statistics that could be much more user-friendly while still packing so much scientific punch.
Plus, with the advent of more powerful desktop computers and Web servers, it is possible to make our use of percentages even more powerful and precise by using some of the new randomization strategies that, in essence, bypass traditional measures of significance altogether.
 Go back to the Content Analysis page. Go back to the Content Analysis page.
|
