Brain Temperature Variations with Paradoxical Sleep: Implications for Relationships among EEG, Cerebral Metabolism, Sleep, and Consciousness
Allan Rechtschaffen, Paul Cornwell, William Zimmerman, and Marvin Bassan
University of Chicago
Proceedings of the Lyon Symposium on Sleep and Consciousness, December 1965.
This study was supported by Grant M-04151 and by Research Career Program Award MH-K3-18,428 from the National Institute of Mental Health, U.S. Public Health Service to Allan Rechtschaffen.
 Download a PDF of this article Download a PDF of this article
Abstract
Increased unit firing rates in several brain areas (Bizzi et al. 1964; Evarts 1962, 1964; Huttenlocher 1961) and the dreams of humans (Aserinsky and Kleitman 1953; Dement and Kleitman 1957) during paradoxical sleep suggest increased cerebral metabolism during these periods. This possibility was studied by using variations in brain temperature in the cat as an index of changes in cerebral metabolism. Preliminary reports of increased brain temperature during paradoxical sleep have come recently from three different laboratories (Hanai and Delgado 1965; Kawamura and Sawyer 1965; Rechtschaffen et al. 1965). This report will document further and elaborate upon brain temperature-paradoxical sleep relationships and will consider their implications for the correlation between sleep, consciousness, EEG, and cerebral metabolism.
Method
Thermistors (Yellow Springs #44005) were chronically implanted in several brain sites of 12 cats, along with electrodes for recording EEG, eye movements (EOG), and nuchal muscle tone (EMG). The thermistors were rated as accurate to within 0.2°C, and our own tests showed that randomly selected pairs of thermistors were matched with each other well within these limits. The thermistors were insulated with vinyl and had time constants of about 2 sec. Recordings were made on a Beckman Type R Dynograph, using the 9858 thermistor coupler for temperature recordings. Calibration for absolute temperature was made with 0.01% accurate resistors and resistance equivalent values provided by the thermistor manufacturer. Recordings were made from unanesthetized and unrestrained cats in sound insulated cages and relatively stable temperature environments.
Results
Brain Temperature and Paradoxical Sleep
From 13 to 70 PSPs (paradoxical sleep periods) were recorded from each cat, producing a total of 437 PSPs. In eight cats, temperature was recorded from more than one brain site, producing a total of 689 separate temperature recordings during PSPs. The only restrictions in selection of data were that the recording be technically good and that the PSP be at least 2 min. long. Because brain temperature frequently continued to increase throughout the first 2 min. of a PSP or longer, the selection of short PSPs would produce unrepresentative values for the magnitude of the temperature rises.
Brain temperature increased at the start of all but 19 of the 689 PSP recordings. Most of the 19 PSP temperature declines came from one thermistor in one cat. Table I summarizes the data on magnitude of PSP brain temperature rise. Typically, the maximal rise during a PSP was between 0.1°C and 0.4°C, although individual rises were as large as 0.7°C.
The values for cortical temperature rise recorded from epidural thermistors were probably masked by temperature gradients across the dura; subcortical values were considerably higher than cortical values in two cats with epidural cortical thermistors, but approximated cortical values in cats with subdural cortical thermistors.
Table I. Brain Temperature Increases during Paradoxical Sleep
| Cat | No. of PSPs | Thermistor Location | Mean max. rise °C | S.D. | No. of drops* | Anat. Verif.† |
|---|
| Michel | 69 | Longitudinal fissure | .18 | .10 | 1 | + |
| Bill | 20 | Third ventricle | .18 | .10 | 1 | + |
| Francois | 69 | Cortex – epidural | .16 | .08 | 1 | + |
| Danielle | 24 | Cortex – epidural | .17 | .09 | 0 | + |
| Ian | 70 | Cortex – epidural | .13 | .07 | 0 | + |
| Parahippocampal gyrus | .22 | .09 | 0 | + |
| Donald | 55 | Cortex – epidural | .10 | .04 | 0 | + |
| Anterior commisure | .18 | .07 | 0 | + |
| Sigmund | 20 | Cortex – frontal epidural | .16 | .06 | 3 | + |
| Cortex – occipital epidural | .09 | .07 | 13 | + |
| Willy | 20 | Cortex – frontal epidural | .44 | .15 | 0 | + |
| Cortex – occipital epidural | .30 | .10 | 0 | + |
| Cay | 20 | Cortex – occipital subdural | .28 | .09 | 0 | + |
| Preoptic nucleus | .30 | .13 | 0 | o |
| Paul | 21 | Cortex – occipital subdural | .16 | .06 | 0 | + |
| Hippocampus – ventral | .16 | .07 | 0 | o |
| Betty | 13 | Cortex – occipital epidural | .14 | .04 | 0 | + |
| Cortex – occipital subdural | .18 | .06 | 0 | + |
| Pons | .10 | .03 | 0 | o |
| Louise | 20 | Preoptic nucleus – rostral | .29 | .06 | 0 | o |
| Preoptic nucleus – caudal | .26 | .05 | 0 | o |
| Lateral geniculate nucleus | .28 | .08 | 0 | o |
* Indicates the number of paradoxical sleep periods during which a drop in temperature was recorded. These periods are not included in the calculation of mean maximal rise (difference between temperature at the start of a paradoxical sleep period and the maximal temperature for that period).
† Continuing experimentation with these cats precludes verification of anatomical site for those stereotaxically implanted thermistors indicated with an "o".
While all brain sites studied showed PSP temperature rises, little can be said about regional differences in rise magnitude from the small number of unsystematically selected recording sites. Furthermore, unless temperature gradients are evaluated, it is difficult to know whether changes recorded at a specific site represent physiological changes at that site or heat transfer from other areas. Differences among cats in brain temperature rise during PSPs were more striking than regional differences in the same cat.
Figures 1, 2, and 3 show the typical course of variations in brain temperature during PSPs: a relatively stable brain temperature level during slow wave sleep (high voltage EEG, presence of tonic EMG, and virtual absence of rapid eye movements) and a fairly abrupt rise with the start of paradoxical sleep (low voltage EEG, absence of tonic EMG, and the presence of rapid eye movements). The specificity of the temperature rise to PSP is seen most clearly in Fig. 2 where there is a steep rise at the start of an "aborted" PSP, a steep decline during a short return to slow wave sleep, a rise and sustained elevation during a long PSP, and a steep decline with the final return to slow wave sleep. All three recordings represent the typical overall parallelism of temperature recordings from different brain sites.
A consistent sequence of changes in brain temperature, EEG, and EMG at the start of each PSP could have implications for possible PSP triggering mechanisms. At the very least, knowledge of such sequences would eliminate some of the possible causal relations among these variables. Initiation of each change is difficult to define with precision. Brain temperature shows continuous minute variation; EEG desynchronization is not abrupt; loss of tonic EMG, especially when viewed in integrated recordings, is almost always gradual. Therefore, the sequence of changes was defined by conservative criteria. "Preceding" was defined as a measure showing an unambiguous change (increase in temperature, decrease in EEG amplitude, loss of tonic EMG) from a prior stable baseline at least 30 sec. before a similarly unambiguous change in another physiological variable. If two measures changed within the same 30 sec. period, the changes were arbitrarily defined as having occurred at the same time. Using these criteria, temperature rises preceded EMG changes in 0.1% of PSPs and followed EMG changes in 23.5% of PSPs. Temperature rises preceded EEG changes in 18.9% of PSPs and followed EEG changes in 26.0% of PSPs. Thus, sometimes the temperature changes shortly preceded EEG and EMG changes at the start of PSPs, and sometimes shortly followed them, but most often the three changes occurred at about the same time.
In short PSPs the brain temperature usually described a smooth ascending curve, e.g., Fig. 1. In longer PSPs, brain temperature usually stabilized at a plateau on which there were minor variations, e.g., Fig. 2. Phasic dips in brain temperature during PSPs almost never reached pre-PSP baseline values. Momentary reappearance of tonic EMG or EEG slow waves during a PSP were always accompanied by corresponding dips in the brain temperature.
Typical changes at the end of PSPs are represented in Figs. 1, 2, and 3. With a return to slow wave sleep, brain temperature always declined, usually to about pre-PSP baseline level, e.g., Fig. 2. The temperature decline sometimes preceded, sometimes followed the EMG and EEG change by a short interval. If the cat awakened from a PSP, brain temperature could either decline, as in the short period of wakefulness at the end of the PSP in Fig. 1, remain at about the same level as in Fig. 3, or rise. When the cat was quiet or drowsy upon awakening, the waking brain temperature sometimes dropped from the PSP level; when the cat seemed alert or excited upon awakening, brain temperature was more likely to rise.
Basis of the Temperature Increase
Blood flow variations and/or metabolic heat production could conceivably cause the PSP brain temperature rises. Two factors should be evaluated to determine whether the brain temperature rises during PSPs are caused by blood flow variations: 1) the temperature of the brain with respect to the temperature of the blood entering the brain and 2) the amount of cerebral blood flow. For instance, if the temperature of the brain is higher than that of the blood entering it, an increase in cerebral blood flow should cool the brain, and a decrease in cerebral blood flow should result in a heating of the brain.
The finding of Feitelberg and Lampl (1935) that temperature in the carotid artery of awake, unanesthetized cats was consistently lower than the temperature of the cerebral cortex provides evidence that the temperature of the blood entering the brain is cooler than the brain. In humans, the temperature of the venous drainage of the brain is higher than intracardiac temperature, and the difference increases the closer to the brain the venous drainage is recorded (Eichna et al. 1951).[1] These findings are consistent with the higher respiratory rate of cortical tissue over most other body tissue (Krebs 1950). However, the above results were not obtained during sleep; therefore, it was necessary to determine whether brain temperature remained higher than the temperature of the blood entering the brain at the beginning of PSPs, and whether there are any increases in body temperature during PSPs which might raise the temperature of the blood entering the brain at those specific times. Unfortunately, we were not successful in obtaining reliable measures of the temperature in the arteries entering the brain. Therefore, the only information we have on these questions is based upon data gathered from thermistors[2] we implanted in the peritoneal cavity of three cats. If the intraperitoneal temperature can be considered representative of the temperature of the blood entering the brain, then the evidence indicates that this temperature is usually below the temperature of the brain at the start of PSPs and that there are no increases in body temperature specific to the PSP which could account for the rise in brain temperature. We noted no consistent change in the difference between intraperitoneal and brain temperature in the passage from wakefulness to sleep; sometimes the brain temperature declined more than the intraperitoneal temperature, and sometimes the reverse was true, e.g., Fig. 5. In two of the three cats, the brain temperature was higher than the intraperitoneal temperature at the start, middle, and end of all PSPs. In the third cat, brain temperature was higher than intraperitoneal temperature at the start of only 43% of the PSPs. However, maximal brain temperature recorded during the PSP was higher than the intraperitoneal temperature in 78% of the PSPs. (The subcortical temperature recording in Fig. 1 is a good example of a rise in brain temperature during a PSP to a level well above the intraperitoneal level.) Intraperitoneal temperature most frequently remained level throughout the PSP, e.g., Figs. 1 and 3. During some PSPs there was a slight decrease in intraperitoneal temperature, e.g., Fig. 5, which may have resulted from the decline of tonic muscle activity during PSPs.[3] While intraperitoneal temperature is certainly not exactly representative of the temperature of the blood entering the brain, one would expect that any marked changes in the temperature of the blood entering the brain would be accompanied by changes in intraperitoneal temperature which were at least in the same direction. Therefore, the data of Feitelberg and Lampl on entering blood temperature during wakefulness, combined with our intraperitoneal data obtained during sleep, constitutes fairly substantial evidence that the temperature of the blood entering the brain during PSPs is probably lower than the brain temperature.
An increase in cerebral blood flow during PSPs has been indicated by three different techniques. Using a thermal technique which had been validated in vivo as a measure of blood flow, Kanzow (1965) found that cortical blood flow increased in all PSPs, with the maximum value about 30-50% above the slow wave sleep level. Kety (1965) measured massive, generalized increases in cerebral blood flow by autoradiographic methods.
In the present study, we monitored changes in cerebral pulse volume with mercury strain gages (Parks Electronics) — small elastic tubes filled with mercury and fixed with wire leads at each end. A gage was wrapped around a cerebral hemisphere of one cat and lightly stretched epidurally over the cortex of another cat. In one cat, pulse volume (measured by changes in impedance which result from stretching and relaxation of the gage) increased from the immediately preceding slow wave sleep in 35 of 38 PSPs, e.g., Fig. 4. In the other cat, pulse volume increased in 44 of 49 PSPs. Several recordings were made when the position of the cat, as monitored by direct inspection, did not change with the start of the PSP, thus demonstrating that the change in pulse volume was not caused by the lowering of the head which frequently accompanied the start of a PSP. In vitro controls demonstrated that temperature changes of the magnitude encountered in the cat brain could not, by a direct influence on the impedance of the strain gages, produce changes in recorded pulse volume of the magnitude encountered at the start of PSPs. The increases in pulse volume during PSPs correspond with similar results obtained by Peter Henry and William Dement (personal communication) from pressure changes in cannulae implanted in the cerebral ventricles. Conceivably, the increased pulse volume could occur without an augmented cerebral blood flow as a result of a decrease in heart rate. In one cat pulse rate did decrease in 30 of 38 recorded PSPs, but in the second cat pulse rate increased in 35 of the 49 PSPs. Most likely, the increase in cerebral pulse volume during PSPs results from dilation of cerebral vessels, rather than from increased blood pressure, because in the cat blood pressure in the common carotid artery most frequently decreases with PSPs (Candia et al. 1962; Kanzow et al. 1962). The decrease in blood pressure in the carotid would also indicate that there is probably no occlusion of the cerebral capillary bed or venous drainage during PSPs which might permit an increase in pulse volume without a concomitant increase in blood flow.
In contrast to the above evidence, Birzis and Tachibana (1963) found a decrease in the amplitude of pulsate changes in tissue impedance in the cortex and hippocampus during PSPs, which they interpreted as the result of decreased blood flow. However, the theoretical basis of tissue impedance measures is not entirely clear. Moskalenko et al. (1964) attribute impedance changes to variation in the proportion of blood to CSF, with increased blood volume producing increased impedance. Sigman et al. (1936) found a decrease in impedance with increased blood flow in fixed volume conduits, which they interpreted as the result of greater uniformity of red cell distribution at higher velocities. Thus, pulsate changes in blood flow and blood volume could produce opposite effects on impedance, and change in impedance pulse amplitude could reflect either increased or decreased blood flow, depending on the relative contribution of the volume and velocity components. Other pulsate changes which affect impedance, e.g., temperature, could further complicate the picture. In vitro calibrations of impedance with flow rate, such as those of Birzis and Tachibana, which utilize saline solution instead of blood, fixed temperatures, and, in all likelihood, a fixed volume conduit, would not entirely replicate physiologic contributions to impedance. Finally, it should be noted that the interpretation of impedance pulse amplitude as reflecting blood flow does not coincide with results obtained by more direct measures of blood flow. Birzis and Tachibana recorded either decreases or no change in impedance pulse amplitude in the association cortex in response to arousing stimuli, while Kanzow's thermal technique (which was calibrated against venous drainage from the cortical area investigated with an average error of &plusminus;10%) yielded increases in cortical blood flow to arousing stimuli (Kanzow 1961) as well as during PSPs. Similarly, Ingvar (1958) recorded increased drainage from the cannulated superior sagittal sinus in response to arousing stimuli. On the basis of the combined evidence, it seems reasonable to accept the findings of increased cerebral blood flow during PSPs over the findings of the more ambiguous impedance measures.
Increased cerebral blood flow during PSPs is in itself highly suggestive of increased cerebral metabolism, because CO2 is both the "main product of cerebral metabolism" and "a more powerful cerebral vasodilator than any other substance yet studied" (Lassen 1959, p. 201). The combined results of a large number of studies summarized by Lassen indicate that the major control of cerebral blood flow is by regulation of the myogenic tone of the vascular walls in response to the changes in carbon dioxide tension and oxygen tension which result from oxidative metabolism.
Taking the temperature and blood flow findings as a whole, the weight of evidence is that: the brain is warmer than the blood entering it; there is an increase in cerebral blood flow during PSPs; consequently, the increase in brain temperature during PSPs is best explained by an increase in metabolic heat production. In turn, this suggests that the increased blood flow is at least partly in response to higher CO2 levels in the brain which result from increased metabolic activity.
Causal Relationships between Cerebral Metabolism and Paradoxical Sleep
Most likely, the mechanisms of paradoxical sleep are the cause, rather than the result, of the phasic increases in brain metabolism during paradoxical sleep, although the evidence for this position is somewhat qualified. (a) Phasic increases in brain temperature occur irregularly during slow wave sleep (Fig. 7) without any signs of paradoxical sleep activity, but it is possible that metabolic increases trigger PSPs only when certain, yet unknown, neural or chemical conditions for PSPs are present. (b) The lateral geniculate "spikes" of 35 to 100 msec. duration and 200 to 500 µV amplitude which are a regular concomitant of PSPs (Bizzi and Brooks 1963; Mikiten et al, 1961) usually precede the desynchronization of the EEG and the loss of tonic EMG by 30 sec. or longer (Michel et al. 1964). Typically, the PSP brain temperature rise, including the rise in the lateral geniculate and pons, did not occur until after the lateral geniculate spiking had begun. Thus, the earliest observed signs of PSPs almost always preceded the brain temperature increases. The qualification here is that small, localized metabolic increases associated with the spikes could have escaped detection by the thermal technique. In one sense, the neural and chemical processes which are responsible for paradoxical sleep must be inseparable from specific metabolic events, and the above discussion of causality refers most appropriately to the relatively generalized, large, PSP-specific metabolic increases indicated by the temperature data.
Do PSPs play a role in the quantitative regulation of brain metabolism? For example, are PSPs triggered when brain metabolism fails below certain levels? The answer is probably not, at least insofar as brain metabolism is reflected in brain temperature. Recordings monitored continuously for four days with two different cats showed no clear relationship of low brain temperature levels to increased frequency of PSPs, except insofar as brain temperatures were generally lower during sleep per se. Neither was absolute brain temperature preceding PSPs related in any systematic way to the duration of PSPs or the amount of temperature rise during PSPs. In one of the two cats intraperitoneal temperature was monitored and, as would be expected, basal levels of cerebral and systemic temperature followed similar long term diurnal curves (Fig.5).
Changes in Brain Temperature Outside of PSPs
Our observations confirm the finding of Serota (1939) that brain temperature usually, but not always, falls with sleep and rises with awakening (Figs. 3 and 5). In fact, periodic increases in hypothalamic temperature of 3 to 12 min. duration during sleep observed by Serota may have represented PSP temperature rises which could not be identified as such because paradoxical sleep had not yet been identified. This interpretation, however, is tempered by Serota's failure to observe simultaneous temperature rises in other brain sites.
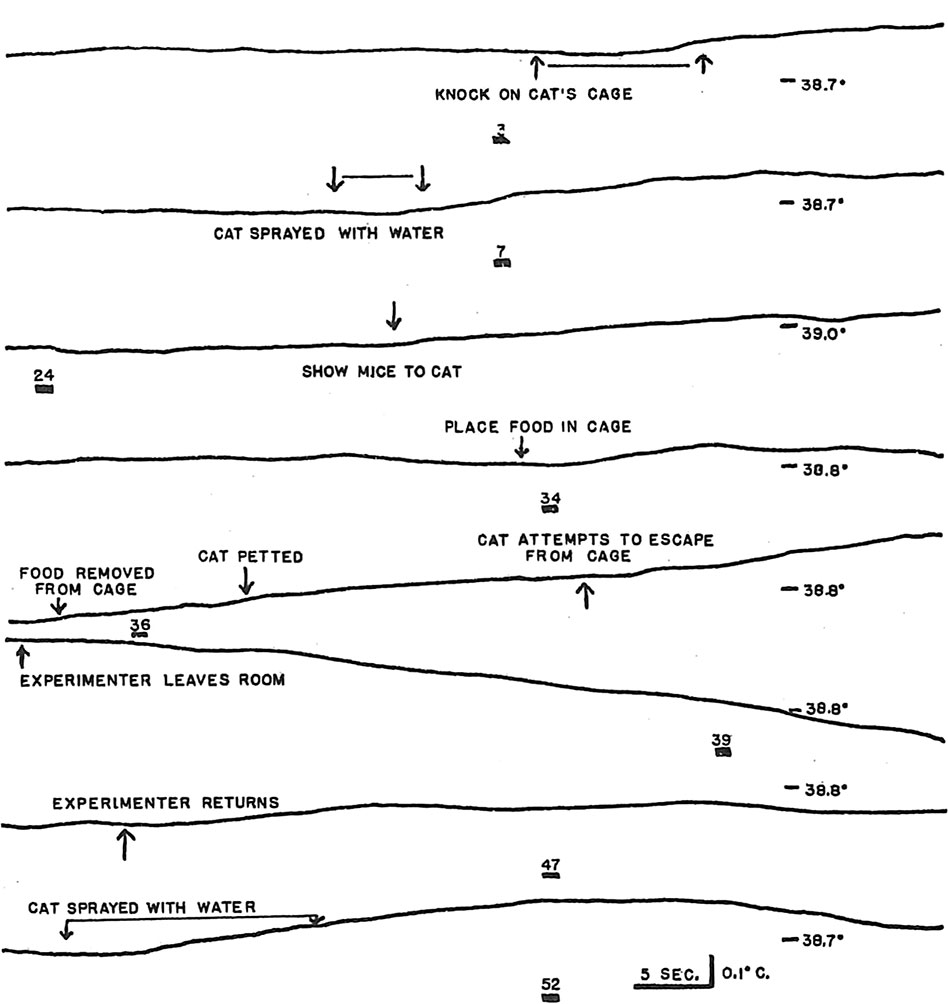
We also observed rises in brain temperature in response to external stimuli, as well as the localized temperature responses to light in visual cortex and lateral geniculate nucleus that were reported by earlier investigators (Feitelberg and Lampl 1935; Serota and Gerard 1938). Figure 6 illustrates typical brain temperature responses to external stimuli and declines following cessation of the stimuli. Impressionistically, it appeared that there was at least a crude relationship between the degree of behavioral arousal elicited by the stimulus and the magnitude of the increase in brain temperature. Sugano and Inanaga (1961) have reported the sama impression. Only the most intense external stimuli, e.g., spraying the cat with water, elicited rises of brain temperature of the magnitude routinely observed in PSPs.
Earlier studies indicated that the cerebral temperature rises with stimulation were the result of increased metabolic heat production rather than increased blood flow. Feitelberg and Lampl (1935) observed that brain temperature was higher than carotid temperature and that the difference between the two temperatures increased with most forms of stimulation. Serota and Gerard (1938) heated a needle 2°C and continued to observe initial rises in brain temperature at the heated site with stimulation. (A subsequent fall in brain temperature is attributable to the cooling effect of increased blood flow.) In such instances, where the brain temperature is unambiguously higher than the temperature of the blood perfusing the brain, the temperature rise cannot result from increased blood flow through the brain. It is doubtful that the rises in brain temperature with stimulation could result from cerebral vasoconstriction and a consequent diminution of cooling blood flow. Ingvar (1958) found that stimulation most frequently produced increases in cortical blood flow, which he in turn attributed to increased metabolism. Sugano and Inanaga (1961) interpreted the rises in brain temperature in response to stimulation as caused partly by increases in blood flow, but they offered no support for this interpretation.
Ogata (1959) argued that blood flow variations played a greater role than metabolic heat production in the short term brain temperature changes associated with arousal. His arguments are equivocal. As support for the blood flow interpretation, Ogata argued that thalamic temperature showed more variability than frontal lobe temperature; however, regional differences in metabolic heat production may exist as well as regional differences in vascularity, Ogata observed that adrenalin and acetylcholine, both presumed cerebral vasodilatative agents, increased brain temperature. Actually, it is not clear that adrenalin dilates cerebral vessels and it may increase cerebral metabolism (Sokoloff 1959). Furthermore, the drugs were administered to cats under pentobarbital anesthesia. Serota and Gerard noted that under drug-induced narcosis, brain temperature may become lower than the temperature of the blood entering the brain. Thus, while acetylcholine does dilate cerebral vessels, it may cause brain temperature to rise only under conditions of narcosis. Finally, Ogata cited two studies as evidence for a warming effect of entering blood on brain tissue. Ogata cited Forster and Ferguson (1951) as showing that in "…unanesthetized cats the hypothalamus is from 0.5°C to 1.2°C below the rectum." (Ogata 1959, p. 77.) Actually, Forster and Ferguson reported that hypothalamic temperature ranged from 0.52°C above to 1.2°C below rectal temperature, and their report gave no indication of which were the most representative values or of whether the low hypothalamic temparatures were achieved under normal conditions. Ogata cited the finding of Eichna et al. (1951) that rectal temperature approximates the temperature of the venous drainage of the brain, but failed to cite the more pertinent finding from the same report that the venous drainage of the brain is warmer than intracardiac temperature, and that the closer to the brain the venous temperature is recorded, the greater the difference.
We recorded, as did Adams (1963), fairly large, sometimes rhythmic fluctuations in hypothalamic temperature during slow wave sleep (Fig. 7). In our results, these changes in temperature during slow wave sleep appeared unpredictably for extended periods, but were not characteristic of all slow wave sleep. Considering the vascularity of the hypothalamus and the rapidity of the temperature changes, Adams was inclined to interpret these changes as resulting from local blood flow variations rather than from variations in metabolic heat production. Several of our observations argue for a metabolic interpretation:
(a) Rapidity of the temperature change does not necessarily indicate that the change results from variations in blood flow. Changes in brain temperature during PSPs and arousal almost certainly reflect changes in metabolic rate and can occur at least as rapidly as the variations in temperature during slow wave sleep.
(b) The temperature variations during slow wave sleep were not localized to the vascular hypothalamus. We have observed parallel changes in temperature in practically all brain sites tested.
(c) The variations in brain temperature during slow wave sleep were frequently accompanied by corresponding changes in EEG activity. Rises in temperature were accompanied by a reduction in large amplitude slow wave activity. The periodic increases in temperature and diminution in slow wave activity were not necessarily correlated with behavioral arousal. Behavioral sleep was maintained, EEG amplitude was not fully reduced to the level characteristic of wakefulness, and the variations in temperature and EEG could occur in the absence of changes in the EMG tracing. Figure 7 illustrates the relationship between brain temperature and EEG activity during slow wave sleep. The second tracing shows the conventional EEG. The sixth tracing shows the EEG filtered to accept only slow wave activity, with a rectification of the filter output so that all voltage increments, negative and positive, are represented by upward pen deflections. Because brain temperature and EEG voltage are negatively correlated, the subcortical temperature (anterior commissure) tracing was inverted and superimposed on the rectified EEG trace for ease of inspection.
The correlation between EEG activity and brain temperature during periods of slow wave sleep does not in itself prove the metabolic basis of the temperature variations. However, some indirect evidence on this question comes from the work of Ingvar (1958) who showed that blood flow variations, in and of themselves, are not likely to cause EEG changes, and that relationships between EEG amplitude and cortical blood flow are probably mediated by increased cerebral metabolism. Although a generalization from Ingvar's preparations to the natural sleep conditions of this study is required, it does not seem likely, in view of the correlated EEG changes, that the brain temperature variations are primarily the result of blood flow variations.
Discussion
In an effort to understand the physiological bases of sleep and consciousness, researchers have built a substantial literature on the interrelationships of four major variables: behavioral sleep, EEG, cerebral metabolism, and consciousness. The results of the present study have relevance for the relationships between several pairs of the four variables; for the sake of completeness, all of the pairings will be given at least a cursory review.
In this review, the definition of consciousness presents a problem. The publicly observable operations used to define consciousness are almost completely lacking in face validity. Few would seriously argue that motor responses and verbal reports are substantively the same as that "internal stuff" which is really the focus of interest. Failure to move or verbalize could represent a specific failure of response apparatus without a concomitant absence of thought or imagery, or complex motor acts could be executed without consciousness. Therefore, the pursuit of consciousness is at a cost of definitional and conceptual leniency. The cost will be increased further in the present discussion, because we shall assume that consciousness exists in different amounts along a dimension we shall call "intensity." Largely on the basis of subjective impressions, consciousness will be presumed to be more intense as emotions are more aroused, as images are more vivid, and as effort is expended in mental work. This intensity dimension, which will be the focus of our interest, is different from the varying qualities of consciousness which are manifest in particular emotions, percepts, or thoughts. For example, we will be interested in whether one is experiencing strong emotion rather than in whether the feeling is anxiety or elation, in whether one is having vivid images rather than in what he is seeing, in whether one is "thinking hard," irrespective of whether the thought is entirely logical or realistic. The assumption underlying the focus on intensity rather than quality is that the existence of consciousness might conceivably depend upon energy transformations which could be reflected in the relatively limited dimensions of EEG frequency and voltage or metabolic rate. The almost endless varieties of mental quality, on the other hand, must certainly demand highly differentiated processes which the simple dimensions of EEG and metabolic rate could hardly begin to approximate.
The definitions of sleep and cerebral metabolism present problems which are similar to the problem of defining consciousness in that operational measures which are not isomorphic to the constructs or intervening variables of interest must be used as indices of them. However, there is generally more confidence that the behaviors (or lack of behaviors) used to define sleep, and that the physiological changes used to define unobservable metabolic events, reflect their respective constructs better than behavioral measures reflect consciousness. EEG is a different class of variable in that it is immediately defined by the measuring operation. Historically, however, the relationships of EEG to consciousness, sleep, and cerebral metabolism have been of great interest, so all four variables will be considered in the same discussion.
EEG and Sleep
Although for many years a high voltage, slow wave, spindling EEG was virtually the sine qua non of sleep, these two variables have been dissociated in several dramatic ways. Wikler (1952) demonstrated that atropine produces a slow wave EEG during behavioral wakefulness. Conversely, under cholinergic drugs, behavioral drowsiness may be accompanied by fast, low voltage EEG activity (Bradley and Elkes 1953). The dissociation of behavioral arousal from a low voltage EEG does not require the action of drugs. Aserinsky and Kleitman (1953) and Dement and Kleitman (1957) demonstrated that extended, regularly appearing periods of behavioral sleep occur in the presence of a low voltage, desynchronized EEG. Furthermore, the alpha rhythm, which has classically been associated with wakefulness, may at times be dissociated from it. Two subjects, upon falling asleep with their eyelids taped open, had no recall for objects exposed in front of them during the period of alpha EEG and slow eye movements which usually precedes unambiguous sleep in the human (Rechtschaffen and Foulkes 1965). The dissociation between EEG slow wave or spindling patterns and behavioral sleep are so profound that EEG patterns may be considered indicative of sleep only under the specific conditions where the EEG patterns have been correlated with behavioral criteria.
Sleep and Cerebral Metabolism
The data of Serota (1939) and of the present study show that brain temperature in the cat most frequently falls at sleep onset. Further, Serota found only slight temperature declines in a heated needle during sleep (presumably, relative to the decline in the unheated needle), indicating that the temperature declines in unheated regions were most likely the result of reduced metabolic heat production rather than blood flow variations. (The heated needle technique of Gibbs (1933) is based on the expectation that increased blood flow would decrease the temperature of a needle that is heated above its physiological environment.). However, both in Serota's study and in the present study, there were many unambiguous instances in which brain temperature failed to decline, or even increased with sleep onset. Serota speculated that failures of temperature decline with sleep could be the result of confounding variables, e.g., a cold meal prior to sleep could reduce brain temperature to such a degree that it would continue to rise following sleep onset. By the same token, however, it is possible that the temperature declines at sleep onset result from changes in variables which are usually correlated with sleep, but which are not a necessary concomitant of it. For example, declines in brain temperature or metabolic rate at sleep onset might be more closely associated with changes in motor activity or diurnal rhythm than they are with sleep per se.
We are again in agreement with Serota that brain temperature usually rises with awakening. However, we have frequently observed declines in temperature when the cat awakens from PSFs. While the contribution of blood flow changes to these declines has not been clarified, the possibility of a decrease in cerebral metabolism upon awakening is suggested. The marked increases in brain temperature during PSPs, in the absence of a behavioral awakening, are in themselves suggestive of a profound dissociation between behavioral sleep and cerebral metabolism.
Apart from the relatively short term changes which occur in the transitions between wakefulness and sleep and during sleep, is the question of whether certain low basal levels of cerebral metabolism are necessary for sleep to occur and be maintained. The current temperature data provide no conclusive answer to this question; the contribution of blood flow, brain-body temperature differences, and brain-environment temperature differences would have to be known before absolute brain temperature levels could be used with confidence as indicators of absolute levels of cerebral metabolism. Nevertheless, the brain temperature data may be viewed as a first approximation of the answer to this question, and this approximation suggests an absence of intimate relationship between sleep and basal levels of cerebral metabolism. Figure 5, which is representative of typical long term brain temperature variations, shows that brain temperature tends to be lower during sleep, especially slow wave sleep, than during wakefulness. This observation is consistent with Shapot's (1957) report of lowered ADP/ATP ratios following sleep. However, there is marked overlap in the brain temperature data. Sleep sometimes occurs at brain temperature levels considerably above those of certain periods of wakefulness and, conversely, some periods of wakefulness occur at brain temperature levels considerably below those of sleep. A major determinant of both absolute brain and absolute systemic temperature appears to be major, long term diurnal changes which proceed with considerable independence of sleep and wakefulness.
The most direct evidence that sleep does not always involve a decrease in cerebral metabolism comes from the work of Mangold et al. (1955), who found no significant decrease in cerebral oxygen consumption, as measured by the Kety-Schmidt Method (1948), at sleep onset in humans. This result does not necessarily contradict findings by thermal techniques of a decrease in cerebral metabolism at sleep onset in most instances. Because of the difficulty subjects had in falling asleep under the conditions of the experiment (needles inserted in the femoral artery and internal jugular bulb), Mangold et al. could obtain only one sleep-wakefulness comparison for each of six subjects. Actually, five of the six subjects showed lower cerebral oxygen consumption values during sleep, and it is conceivable that with more determinations the results could have resembled the distribution of increases and declines obtained by thermal techniques.
In summary, the evidence is that sleep may frequently, but need not necessarily, be accompanied by a decline or low basal level of cerebral metabolism. Where a relationship between sleep and cerebral metabolism does obtain, it is not certain whether the relationship is specific to sleep or whether it is based upon declines in functional activity and/or diurnal changes which are usually, but not necessarily, related to sleep.
Sleep and Consciousness
So long as dreams could be regarded as rare, brief experiences, sleep could be regarded mainly as a state of diminished or little consciousness. However, the work of Aserinsky, Kleitman, and Dement firmly established that dream reports were regularly elicited on awakenings from PSPs in humans. The correspondence between the content of the reports and eye movement patterns, and between judgements of dream duration and length of PSPs, leaves little doubt that the reported mentation was experienced during sleep. Based on typical amounts of paradoxical sleep in the human, about 25% of nocturnal sleep is spent in dreaming. Furthermore, this figure underestimates the total amount of mental activity during sleep. Reports of mental activity are also elicited on awakenings from slow wave sleep, although these reports are generally less dreamlike and more thoughtlike than those elicited on awakenings from PSPs (Foulkes 1962; Rechtschaffen et al. 1963; Monroe et al. 1965). Sleep onset is frequently a period of intense mental activity (Foulkes and Vogel 1965). The question of whether there are any periods of natural sleep completely devoid of mental activity now has more vitality than the question of whether there is any substantial amount of mental activity during sleep.
EEG and Cerebral Metabolism
The work of Ingvar (1958) demonstrating a relationship between EEG activity and changes in cortical blood flow, which almost certainly reflected metabolic changes, has already been cited. A more direct measure of cortical metabolism, oxygen consumption, in anesthetized dogs (Gleichman et al. 1962) showed a relationship to EEG frequency, although the degree of relationship was not very high, perhaps limited by the relatively restricted range of activity in the acute preparation.
The present work contributes three additional indications of relationship between EEG activity and cerebral metabolism. First, there is the major finding that desynchronization of the EEG during PSPs is accompanied by increases in brain temperature. Second, during certain periods of slow wave sleep there is a minute-to-minute inverse correlation between EEG amplitude and brain temperature. These two relationships indicate that the EEG-brain metabolism relationship may obtain during behavioral sleep and does not depend upon transitions between wakefulness and sleep as a mediating factor. This principle was supported by additional experiments in which a slow wave EEG was produced by intraperitoneal injections of atropine. With mild doses of atropine (0.5 mg/kg) it was possible to produce transient EEG desynchronization with visual, auditory, or nociceptive stimulation. These desynchronizations were regularly accompanied by nearly simultaneous increases in brain temperature, both in deep structures and in cortical areas immediately adjacent to the EEG recording electrodes; there were no corresponding increases in rectal temperature. While basal brain temperature level declined as high voltage slow EEG activity developed following the administration of atropine, it was observed that rectal temperature also declined by as much as 1°C or more after atropine injection. Therefore, one cannot be certain whether the decline of basal brain temperature level with slow wave activity reflected decreases in cerebral metabolism or changes in the temperature of the body core.
In spite of the above evidence for a relationship between brain metabolism and EEG activity, another experiment revealed that this relationship can be subject to marked dissociations. Ditran (N-ethyl-2-pyrrolidylmethyl-cyclopentylphenylglycolate), another anticholinergic drug which produces a high voltage, slow wave EEG during behavioral wakefulness, was administered to four cats (.05-.08 mg/kg). Stimulation of these cats also produced rises in brain temperature. However, the desynchronization of the EEG upon initial stimulus presentation was either not present or was very transient, i.e., only a few seconds duration, while brain temperature continued to rise for extended periods; the duration and magnitude of the temperature rise was roughly proportional to the duration and intensity of the stimulation. Most dramatic were several instances in which, upon insertion of a rectal temperature probe, the EEG desynchronized for only 1 to 2 sec., while brain temperature rose 0.3°C or more over the course of 2 min. or longer. In one cat, brain and rectal temperature were approximately equal during the measurement of rectal temperature; in two other cats, brain temperature rose to values which were 0.7°C above rectal temperature. Thus, it is most unlikely that the brain temperature rises were the result of increased blood flow.
EEG and Consciousness
Traditionally, a low voltage fast or alpha EEG has been associated with the presence or intensification of consciousness, and a high voltage slow or "sleep spindling" EEG with an absence or diminution of consciousness. The association of a slow wave EEG with diminution of consciousness is based partly on the unresponsiveness of brain-damaged patients with such activity. As noted earlier, it is possible that such unresponsiveness represents a failure of response mechanisms rather than a failure of consciousness. However, acceptance of the latter position virtually nullifies any attempt to define a diminution of consciousness and, along with it, any attempt to relate consciousness to other variables. Therefore, unless there is at least some suggestive evidence to the contrary, e.g., a subsequent report of having had conscious experiences during the period of no response, we share a widespread bias to accept a failure of any of the responses usually associated with consciousness, as in comatose states, with a failure of consciousness. Even with the acceptance of this heuristic bias, however, the association of EEG and consciousness in brain damage does not hold up entirely, as cases of comatose patients with essentially normal EEGs and non-comatose patients with high voltage, slow EEGs have been observed (Marquardsen and Harvald 1964).
A second major basis for the association of high voltage slow wave or spindling EEG with diminution of consciousness has been the presence of these rhythms during sleep. The association of dreams with a low voltage, relatively fast EEG would only serve to underline an association of EEG and consciousness independent of sleep. However, although the dreams of paradoxical sleep are typically more "intense" than the more thoughtlike, muted contents of reports elicited on awakenings from slow wave sleep, a considerable amount of mental activity, and occasionally vivid dreams, are reported upon awakening from slow wave and/or spindling sleep stages. Auxiliary evidence indicates that these reports represent mental activity which occurred during sleep, rather than mere confabulation upon awakening (Rechtschaffen et al. 1963; Foulkes and Rechtschaffen 1964). Therefore, sleep studies provide some support for a correlation between consciousness and EEG pattern, but marked reversals of the usual correlation can occur. The presence of high voltage slow or spindling EEG patterns during sleep cannot be taken as an indicator of lack of consciousness.
The experiments cited earlier concerning the chemically induced dissociation of EEG and wakefulness are also pertinent to the relationship between EEG and consciousness. Specifically, it is difficult to imagine that a cat under atropine or Ditran, who is struggling fiercely with complex purposeful movements as the experimenter takes its rectal temperature, is not having some mental experience.
Insofar as verbal reports from humans are more direct indicators of consciousness than cat behavior, even better evidence for a dissociation of EEG and consciousness exists. Itil et al. (1964) have reported on the changes in consciousness and EEG in humans under Ditran. In one group of subjects, Ditran produced high voltage slow waves and theta waves with superimposed 20-40 cps desynchronized fast activity. These subjects showed "severe anxiety and restlessness associated with an acute fear of death." This intensification of consciousness in conjunction with high voltage slow EEG activity, indicates a dissociation of the usual EEG-consciousness relationship. However, it might be legitimately argued that the presence of superimposed low voltage fast EEG activity, which is usually associated with arousal, in these subjects renders the dissociation incomplete or ambiguous. Another group of subjects showed a less ambiguous slow wave and spindling EEG which resembled that of natural sleep. In this group "restlessness and motor phenomena were slight, withdrawal and mutism were severe and answers to questions were incoherent." At first glance this apparent de-intensification of consciousness with EEG slow waves and spindling speaks for the association of consciousness and EEG activity. However, additional information on the psychological experiences during this Ditran-induced state suggest that the above symptoms indicate a lack of social responsivity rather than a de-intensification of consciousness. Dr. Rosalind Cartwright (personal communication) observed that subjects in the apparently stuporous state described above often reported very vivid and emotion-laden phantasies and hallucinations. These subjects also reported that their preoccupation with the phantasies and hallucinations rendered them unmotivated or unconcerned about making social responses. Paradoxically, they also reported that the external world often seems very threatening and they felt compelled to scan it in detail to take account of every part of it. Perhaps associated with such scanning is the virtual storm of rapid eye movements which Cartwright has observed in humans and we have observed in cats under Ditran.
In summary, the data from brain damaged patients, from sleep studies, and from drug studies all reveal dramatic instances of dissociation between EEG and consciousness.
Cerebral Metabolism and Consciousness
The extensive literature on cerebral metabolism has been reviewed by Lassen (1959), and we will attempt to cover only some of the points which are relevant to consciousness. Except where otherwise indicated, the data reviewed in this section were acquired by the method for measuring cerebral oxygen consumption developed by Kety and Schmidt (1948) or variations of it. Three major types of variation in consciousness have been studied in relation to cerebral metabolism: (a) variations in consciousness associated with pathological conditions or treatment procedures; (b) variations in consciousness associated with drugs; (c) variations in consciousness which occur "spontaneously" or in response to stimulus conditions within the range of normal experience.
Variations associated with pathology. The strongest evidence for a relationship between cerebral metabolism and consciousness is the depressed values for cerebral oxygen uptake in comatose conditions, regardless of the cause of the coma. Lassen's review of 21 different studies indicated that, "In all conditions of semicoma or coma which have been studied — whether due to anesthetics, acute hypoglycemia, apoplexy, or any other cause — the reduction of consciousness correlates roughly with the decrease of cerebral oxygen uptake, regardless of the cause of the acute cerebral disorder" (p. 213).
Treatment procedures appear to produce parallel results in consciousness and cerebral metabolism. Of four patients subjected to unilateral carotid ligation, three showed no clinical effects, while one developed a hemiplegia and semicoma; the effected patient was the only one of the three who showed a substantial reduction of cerebral oxygen consumption following ligation (Shenkin et al. 1951). The reduction of increased intracranial pressure in 12 patients resulted neither in a change in cerebral oxygen utilization or mental state (Shenkin et al. 1948). The improvement in "mental state" following treatment of neurosyphilis was correlated with an increment in cerebral oxygen uptake (Patterson et al. 1950), although it is not clear whether the mental improvement was in terms of "intensity" of consciousness. Linden (1955) described "increased alertness and cooperativeness" in several, but not all cerebrovascular accident patients who showed increased cerebral oxygen consumption following stellate ganglion block.
It is not certain whether impairments of consciousness associated with old age and chronic brain disease entail reductions in intensity, as we have conceptualized it. Insofar as reduced intensity may be involved, available evidence supports a relationship between intensity of consciousness and cerebral metabolism. In two early studies, aged subjects showed lower cerebral oxygen consumption than young subjects, but there was no significant difference between aged subjects with and without clinical signs of brain damage (Fazekas et al. 1952; Fazekas et al. 1955). However, in two more recent studies, using refined techniques which reduced error in the measurement of cerebral oxygen consumption, normal aged subjects did only showed significantly reduced values as compared to normal young subjects, but aged patients with evidence of impairment on psychological tests showed significantly lower values than healthy aged subjects (Lassen et al. 1957; Lassen et al. 1959); there was virtually no overlap in cerebral oxygen consumption between impaired and unimpaired groups. In the more recent of the two studies 7 of 10 mental tests showed correlations of .55 or more with cerebral oxygen consumption.
Analogous to the findings in aged patients, Garfunkel et al. (1954) reported lower values for cerebral oxygen consumption in mentally retarded children with central nervous system defects and a relationship between mental ability and oxygen consumption in the impaired group. As in the case of the aged organic patients, there is no certainty that the children with organic damage suffered decrements in the intensity as well as in the quality of consciousness, but the "dulled" mentation of such patients has often been noted clinically, and it is a likely possibility. In the case of schizophrenia, where one would expect to find a less intense consciousness only in some severely regressed patients, it is unlikely that there is any significant decrease in cerebral oxygen utilization. (See Lassen's review for a summary of the evidence on this point.)
Variations associated with drugs. The drugs which reduce the intensity of consciousness generally produce corresponding reductions in cerebral oxygen utilization; the amount by which consciousness is reduced is correlated with the amount by which oxygen utilization is reduced, regardless of the drug doses used. This generalization has been supported by numerous studies on the effect of barbiturates, morphine, and alcohol (see Lassen's review). For example, McCall and Taylor (1952) administered sufficient doses of a barbiturate to produce either (1) loss of consciousness, but not "deep" anesthesia, (2) consciousness "barely lost", or (3) "no significant deviations from normal cerebral function" apart from a slight drowsiness in some patients. The reductions in cerebral oxygen utilization (in cc/100 gm brain/min.) from control levels were 1.1, 0.7, and 0.2 for the three groups respectively. In contrast to this evidence, summaries of numerous studies of tranquilizing drugs (Lassen 1959; Sokoloff 1959), which one would expect to reduce the intensity of consciousness, indicate that they have no significant effect on cerebral oxygen consumption.
Studies on the effects of xanthine compounds, which one would expect to intensify consciousness, provide either ambiguous evidence with respect to a consciousness-cerebral metabolism hypothesis or support of it. A study (Shenkin 1951) of nine brain tumor patients revealed no effect of caffeine on cerebral oxygen consumption, but these patients were in "disturbed states of consciousness," so changes in conscious state would be difficult to evaluate. In a study on the effects of aminophylline on patients with evidence of congestive heart failure, the drug actually produced a significant decrease in cerebral oxygen consumption (Moyer et al. 1952). However, the authors point out that the reduction probably resulted from cerebral vasoconstriction produced by the drug in combination with an incomplete compensatory release of oxygen from the blood, which in turn is attributable to the incomplete saturation of hemoglobin with oxygen in these particular patients who showed pulmonary congestion. The author did note that one patient showed signs of anxiety and that this was the only patient who showed an increase in oxygen utilization without a decrease in cerebral blood flow. Neither aminophylline nor caffeine produced increases in cerebral oxygen consumption in patients with hypertensive headaches (Moyer et al 1952). However, the drug produced "almost immediate" relief from the headache in 12 of the 16 patients tested, and it is possible that the headache relief masked the stimulating effects of the drugs. In support of this possibility, of the four patients who reported equivocal or no relief of headache, three showed increases in cerebral oxygen consumption; one patient who became irritable also showed an increase in oxygen consumption. Two studies on xanthine compounds straightforwardly support a correlation of cerebral metabolism and intensity of consciousness. "Dizziness and anxiety were commonly observed" under paraphyllin, which also increased cerebral oxygen utilization (Moyer and Snyder 1954). Of ten patients given aminophylline by Wechsler et al. (1950), four showed extreme anxiety. These four patients had a statistically significant increase in cerebral oxygen consumption, while the remaining six had a statistically significant decrease.
Unfortunately, the evidence on amphetamines and epinephrine with respect to consciousness-metabolism relationships is inconclusive, partly because of conflicting results and partly because of methodological shortcomings in the experiments that were done. Amphetamine sulfate did not produce an increase in cerebral oxygen consumption in doses that usually produce behavioral and/or experiential effects in humans (Abreu et al. 1949). In one study (King et al. 1952) epinephrine increased cerebral oxygen consumption, while no increase was noted in another study (Sensenbach et al. 1953) in spite of evidence of excitement and apprehension in the subjects. In all three studies, however, as well as in several of the studies cited earlier and to be cited later, a methodological shortcoming mitigates the certainty of the conclusions. Control levels of cerebral oxygen consumption were determined after initial preparation of the subject and were followed by determinations under the drug. Conceivably, insertion of needles into arteries and veins, breathing through a face mask, the visibility of complicated equipment, and a general atmosphere of serious scientific endeavor could produce either anxiety, interest, or expectations of unusual events. Habituation to these circumstances could then produce a decrease in both initially elevated excitement and cerebral metabolism. Thus, a decrease in oxygen consumption resulting from habituation could be balanced by an increase produced by the experimental drug, with no apparent difference in control and experimental conditions. One stimulating drug which did produce both mental excitement and increased cerebral oxygen consumption was intravenously administered nicotine (Wechsler 1958).
Variations within the range of normal experience. Two studies on the relationship between cerebral metabolism and mental work produced conflicting results. Sokoloff et al. (1955) found no increase in cerebral oxygen consumption during mental arithmetic. Because the control determinations were always made first, it is possible that decreases in brain metabolism with habituation to the test conditions could have masked increases which accompanied the mental work. This possibility was specifically noted by the authors, who countered with the observation that typical "resting" EEG patterns were observed during the control period as compared with lower voltage, higher frequency patterns during the subsequent arithmetic tests. On the other hand, the authors also cited apprehension about forthcoming performance as a possible source of higher than "normal" values for oxygen consumption during the control period. In a study without habituation confounds, Lombard (1879), on the basis of approximately 60,000 measurements, concluded that scalp temperature rises with both mental work (arithmetic) and emotional excitement. Because similar increases were not recorded from thermocouples placed over arteries at several peripheral sites, Lombard argued that the scalp temperature rises represented changes in activity in the underlying brain tissue. Lombard cited several of his contemporaries who obtained similar results.
A study by Mangold et al. (1955), which reports no significant change in cerebral oxygen consumption following sleep onset, has occasionally been cited as evidence for lack of relationship between cerebral metabolism and consciousness, but this interpretation of the results is not justified in view of the current evidence that considerable mental activity may be present in all sleep stages. A careful comparison of the intensity of consciousness during sleep and wakefulness is required before data on cerebral metabolism during sleep are applied to the question of metabolism-consciousness relationships.
Although mental activity may be present in any of the conventional EEG stages of sleep, it is clear that it is especially intense during PSPs (Monroe et al. 1965). Considering this fact, there is some evidence which suggests a relationship between mental activity and cerebral metabolism during sleep. If one were willing to assume dream activity in the cat during PSPs corresponding to the PSP dream activity of humans, then the present data on PSP brain temperature rises in the cat would be pertinent to the question. Apart from such anthropomorphizing, however, there are indications that humans have PSP increases in cerebral metabolism. (It would indeed be surprising if the PSPs of cats and humans were not similar in such a major respect, considering the great similarity of the PSPs of the two species in most comparable physiological phenomena.) Brebbia and Altshuler (1965) have recently reported an increase in total oxygen consumption of humans during PSPs. Although the increased oxygen consumption has not been localized to the brain, the parallel to the cat data is striking. In another recent study, Cooper (1965) observed very marked periodic increases in intracranial pressure in human patients with high baseline intracranial pressures during certain phases of sleep which were subsequently identified as PSPs (personal communication). At about the time the intracranial reached an asymptotic plateau, cortical oxygen availability declined. At the end of the period, intracranial pressure declined rapidly and oxygen availability returned to earlier levels. It is at least a reasonable hypothesis that the increased intracranial pressure during the PSP resulted from an increased cerebral blood flow which in turn represented a response to increased metabolic activity. According to this view, when blood flow could no longer increase in response to the metabolic demand, the continued utilization of oxygen would cause a net decline of oxygen availability in the brain. (Whether such asymptotic levels of blood flow would also obtain in subjects without space occupying lesions remains an open question.)
In summary, there is much evidence for a relationship between cerebral metabolism and the presence or intensity of consciousness, but not all the available evidence is in support of such a relationship. However, there is no evidence of a clear reversal of the hypothesized direction of relationship as there is with several of the pairs of variables that have been considered here. In several instances where no relationship between cerebral metabolism and consciousness was observed, the failure conceivably could be attributed to limitations of experimental design or only incidental evaluation of mental changes.
Limitations of measuring technique could also militate for a failure to observe consciousness-cerebral metabolism covariations. Changes in consciousness could be accompanied by localized metabolic changes which contribute too little to total cerebral metabolism to be detected by relatively gross techniques, as Sokoloff (1956) has pointed out, or increased metabolism at a site associated with consciousness might be balanced by decreases at other sites. It is also possible that intensification of consciousness occurs in shorter bursts than is generally realized, and that the aggregate of this intensification might be too small relative to error of measurement to produce significant increments in metabolism over the 10 min. period required for a determination by the Kety-Schmidt method. This might account for the generally greater correspondence between cerebral temperature, which requires much shorter measuring intervals, and inferred mental activity than has been observed with the Kety-Schmidt technique (which has the advantage of permitting determinations of absolute metabolic values rather than only directional changes). Thermal techniques would also be more sensitive to any short-term anaerobic metabolic processes that might exist.
While there is some evidence against the cerebral metabolism-consciousness hypothesis, the wealth of evidence for it, combined with the possibilities of error in the negative evidence, suggests that the hypothesis probably deserves more attention than it has received during the past decade. If one is willing to make certain inferences about variations in the intensity of consciousness in the cat, then there is even some evidence that consciousness-metabolism correlations may be maintained in the face of dissociation of other variables. Thus, although behavioral sleep is maintained during the presumably intensified dream activity of the paradoxical phase, the brain temperature rises in agreement with the inferred dream activity. Although the EEG remains synchronized in response to external stimulation in the cat treated with Ditran, the brain temperature rises in agreement with the inferred excitatory ("easy" inference in view of the cat's attentive posture and heightened motor activity) induced by the stimulus.
If there does prove to be a very substantial relationship between consciousness and cerebral metabolism, the further question arises as to its significance. If the consciousness-metabolism relationship were based entirely on the contribution of neural firing to metabolism, then metabolism, in itself, might have little significance except as a convenient method for integrating unit activity. However, cerebral metabolism could reflect energy transformations in the brain beyond those represented by the spikes potential and which are crucial for conscious experience.
Summary
The temperature of the cat brain, measured at several cortical and subcortical sites, rises during paradoxical sleep. The magnitude of the rise in brain temperature varies at different sites and in different cats, but it is most frequently in the range of 0.1°C to 0.4°C. The temperature rises, combined with the data showing an increase in cerebral blood flow during paradoxical sleep, were interpreted as the result of increased cerebral metabolism.
Because the data of the present study involved, directly or indirectly, changes in EEG activity, sleep-wakefulness, cerebral metabolism, and consciousness, the occasion was taken to review the relationships among these four variables. For all pairings of the four variables there was evidence for some degree of relationship, but in most cases there was also evidence for dramatic dissociations. Some evidence indicates that consciousness and cerebral metabolism may be more closely related to each other than either is related to sleep or EEG activity. For example, Ditran, an anticholinergic drug, produced EEG slow waves during behavioral wakefulness in the cat; the brain temperature of the cat increased with behavioral excitement induced by external stimuli, although the slow waves persisted during the period of arousal. The brain temperature rises during paradoxical sleep suggest parallel increases in cerebral metabolism and consciousness (dreaming) during behavioral sleep.
Notes
[1] Measures which depend upon a separation of blood entering and leaving the brain are subject to errors of unknown magnitude as a result of arteriovenous shunts in the blood supply to the brain (Gillilan and Marksbery 1963). However, the amount of shunting must of necessity be small relative to the major arteriovenous differences.
[2] Matched thermistors were used where comparisons of absolute temperature were made.
[3] Dramatic instances of a decline in systemic temperature associated with the inhibition of tonic motor activity during PSPs may be observed in cats under light pentobarbital anesthesia. Although the cortical EEG may remain synchronized, PSPs do occur under light pentobarbital anesthesia (Jouvet 1963), where they can be detected easily by a loss of tonic EMG and the presence of "spikes" in recordings from the lateral geniculate nucleus. With the start of such PSPs, we have observed a dramatic cessation of shivering which was often accompanied by a marked decrease in rectal temperature. Depending on the magnitude of the systemic temperature fall, brain temperature could also decrease. Perhaps, by a similar process, brain temperature elevations in unanesthetized cats are, on occasion, partially masked by transport to the brain of cooler systemic blood.
References
Abreu, B. E., Liddle, G. W., Burks, A. L., Sutherland, V., Elliott, E. W., Simon, A. and Margolis, L. Influence of amphetamine sulfate on cerebral metabolism and blood flow in man. J. Amer. Pharm. Ass., 1949, 38:186-188.
Adams, T. Hypothalamic temperature in the cat during feeding and sleep. Science, 1963, 139:609-610.
Aserinsky, E. and Kleitman, N. Regularly occurring periods of eye motility, and concomitant phenomena during sleep. Science, 1953, 118:273-274.
Birzis, L. and Tachibana, S. Measurement of local cerebral blood flow by impedance changes. Life Sciences, 1962, 11:587-598.
Birzis, L. and Tachibana, S. Local cerebral impedance and blood flow during sleep and arousal. Exp. Neurol., 1964, 9:269-285.
Bizzi, E. and Brooks, D. C. Pontine reticular formation: Relation to lateral geniculate nucleus during deep sleep. Science, 1963, 141:270-272.
Bizzi, E., Pompeiano, O., and Somogyi, I. Vestibular nuclei: Activity of single neurons during natural sleep and wakefulness. Science, 1964, 145:414-415.
Bradley, P. B. and Elkes, J. The effect of atropine, hyoscyamine, physostigmine, and neostigmine on the electrical activity of the brain of the conscious cat. J. Physiol., 1953, 120:13-14.
Brebbia, D. R. and Altshuler, K. Z. Oxygen consumption rate and electroencephalographic stage of sleep. Science, 1965, 150:1621-1623.
Candia, O., Favale, E., Guissani, A., and Rossi, G. F. Blood pressure during natural sleep and sleep induced by electrical stimulation of the brain stem reticular formation. Arch. Ital. Biol., 1962, 100:216-233.
Cooper, R. One direct measure or several indirect ones? World Med. Electron. 1965, 8:297-300.
Dement, W. C. and Kleitman, N. The relation of eye movements during sleep to dream activity: An objective method for the study of dreaming. J. Exp. Psychol, 1957, 53:339-346.
Eichna, L. A., Berger, A. R., Rader, B., and Becker, W. H. Comparison of intra-cardiac and intravascular temperatures with rectal temperatures in man. J. Clin. Invest., 1951, 30:353-359.
Evarts, E. V. Activity of neurons in visual cortex of the cat during sleep with low voltage fast EEG activity. J. Neurophysiol., 1962, 25:812-816.
Evarts, E. V. Temporal patterns of discharge of pyramidal tract neurons during sleep and waking in the monkey. J. Neurophysiol., 1964, 27:152-171.
Fazekas, J. F., Bessman, A. N., Cotsonas, N. J., and Alman, R. W. Cerebral hemodynamics in cerebral arteriosclerosis. J. Gerontol., 1953, 8:137-145.
Fazekas, J. F., Kleh, J., and Finnerty, F. A. Influence of age and vascular disease on cerebral hemodynamics and metabolism. Amer. J. Med., 1955, 18:677-485.
Feitelberg, S. and Lampl, H. Wärmetönung der Großhirnrinde bei Erregung und Ruhe bzw. Funktionshemmung, Arch. Exp. Path. Pharmak., 1935, 177:726-736.
Forster, R. E. and Ferguson, T. B. Relationship between hypothalamic temperature and thermoregulatory effectors in unanesthetized cat. Fed. Proc., 1951, 10:44.
Foulkes, W. D. Dream reports from different stages of sleep. J. Abnorm. Soc. Psychol., 1962, 65:14-25.
Foulkes, D. and Rechtschaffen, A. Presleep determinants of dream content: Effects of two films. Percept. Mot. Skills, 1964, 19:983-1005.
Foulkes, D. and Vogel, G. Mental activity at sleep onset. J. Abnorm. Psychol., 1965, 70:231-243.
Garfunkel, J. M., Baird, H. W., and Ziegler, J. The relationship of oxygen consumption to cerebral functional activity. J. Pediat., 1954, 44:64-72.
Gibbs, F. A. A thermoelectric blood flow recorder in the form of a needle. Proc. Soc. Exp. Biol. Med., 1933, 31:141-145.
Gillilan, L. A. and Markesbery, W. R. Arteriovenous shunts in the blood supply to the brains of some common laboratory animals — with special attention to the rete mirabile conjugatum in the cat. J. Compar. Neurol., 1963, 121:305-311.
Gleichmann, U., Ingvar, D. H., Lassen, N. A., Lubbers, D. W., Siesjo, B. K., and Thews, G. Regional cerebral cortical metabolic rate of oxygen and carbon dioxide, related to the EEG in the anesthetized dog. Acta Physiol. Scand., 1962, 55:82-94.
Hanai, T. and Delgado, J. M. R. Intracerebral temperatures of free moving cats. Fed. Proc. Soc. Exp. Biol., 1965, 24:339. (Abstract)
Huttenlocher, P. R. Evoked and spontaneous activity in single units of medial brain stem during natural sleep and waking. J. Neurophysiol., 1961, 24:451-458.
Itil, T., Fink, M., Neurbauer, H., and Gershon, S. Drug induced dissolution of cortical electrical activity and its correlation with psychopathological phenomena. Paper read at IV International Meeting of the Collegium Internationale Neuropsychopharmacologicum, Birmingham, England, August 1964.
Ingvar, D. H. Cortical state of excitability and cortical circulation. In R. H. Jasper, L. D. Proctor, R. S. Knighton, W. C. Noshay, and R. T. Costello (Eds.), Reticular formation of the brain. Boston: Little, Brown, 1958. Pp. 381-412.
Ingvar, D. H. The electroencephalogram related to the cortical metabolism. In M. Jouvet (Ed.), Neurophysiologie des etats de sommeil. Paris: Centre National de la recherche Scientifique, 1965. Pp. 53-61.
Kanzow, E., Krause, D., and Kuhnel, H. Die Vasomotorik der Hirnrinde in den phasen desynchronisierter EEG-Aktivität im natürlichen Schlaf der Katze. Pflugers Arch. 1962, 274:593-607.
Kanzow, E. Changes in blood flow of the cerebral cortex and other vegetative changes during paradoxical sleep periods in the unrestrained cat. In M. Jouvet (Ed.), Neurophysiologie des etats de sommeil. Paris: Centre National de la Recherche Scientifique, 1965. Pp.231-240.
Kawamura, H. and Sawyer, C. H. Elevation in brain temperature during paradoxical sleep. Science, 1965, 150:912-913.
Kety, S. S. and Schmidt, C. F. The nitrous oxide method for the quantitative determination of cerebral blood flow in man: Theory, procedure, and normal values, J. Clin. Invest., 1948, 27:476-483,
Kety, S. S. Relationship between energy metabolism of the brain and functional activity, Paper read at Ass. for Research in Nervous and Mental Disease, New York, December 1965.
King, B. D., Sokoloff, L. and Wechsler, R. L. The effects of l-epinephrine and l-norepinephrine upon cerebral circulation and metabolism in man. J. Clin. Invest., 1952, 31:273-279.
Krebs, H. A. Body size and tissue respiration. Biochem. Biophys. Acta, 1950, 4:249-269.
Lassen, N. A., Munck, O., and Tottey, E. R. Mental function and cerebral oxygen consumption in organic dementia. Arch. Neurol. Psychiat., 1957, 77:126-133.
Lassen, N. A. Cerebral blood flow and oxygen consumption in man. Physiol. Rev., 1959, 29:183-238,
Lassen, N. A., Feinberg, I., and Love, M. H. Bilateral studies of cerebral oxygen uptake in young and aged normal subjects and in patients with organic dementia, J. Clin. Invest., 1960, 39:491-500.
Linden, L. The effect of stellate ganglion block on cerebral circulation in cerebrovascular accidents. Acta Medica Scandinavica, 1955, 151 (supplement), 1-110.
Lombard, J. S. Experimental researches on the regional temperature of the head. London: H. K. Lewis, 1879.
Mangold, R., Sokoloff, L., Conner, E., Kleinerman, J., Therman, P. C., and Kety, S. The effects of sleep and lack of sleep on the cerebral circulation and metabolism of normal young men. J. Clin. Invest., 1955, 34:1092-1100.
McCall, M. L., and Taylor, H. W. Effects of barbiturate sedation on the brain in toxemia of pregnancy, J. Amer. Med. Assoc., 1952, 149:51-54.
Michel, F., Jeannerod, M., Mouret, J., Rechtschaffen, A., and Jouvet, M. Sur les mécanismes de l'activité de pointes au niveau du système visuel au cours de la phase paradoxale du sommeil. C. R. Soc. Biol., 1964,158:103-106.
Mikiten, T., Niebyl, P., and Hendley, C. EEG desynchronization during behavioral sleep associated with spike discharges from the thalamus of the cat. Fed. Proc. Soc. Exp. Biol., 1961, 20:327.
Monroe, L. J., Rechtschaffen, A., Foulkes, D., and Jensen, J., Discriminability of REM and NREM reports. J. Pers. Soc. Psychol., 1965, 2:456-460.
Moskalenko, Y. E., Cooper, B., Crow, H. J., and Water, G. Variations in blood volume and oxygen availability in the human brain. Nature, 1964, 202:159-161.
Moyer, J. H., Tashnek, A. B., Miller, S. I., Snyder, H., and Bowman, R. O. The effect of theophylline with ethylenediamine (aminophylline) and caffeine on cerebral hemodynamics and cerebrospinal fluid pressure in patient with hypertensive headaches. Amer. J. Med. Sci., 1952, 224:377-385.
Moyer, J. H., Miller, S. I., Tashnek, A. B., and Bowman, R. The effect of theophylline with ethylenediamine (aminophylline) on cerebral hemodynamics in the presence of cardiac failure with and without Cheyne-Stokes respiration. J. Clin. Invest., 1952, 31:267-272.
Moyer, J. H. and Snyder, H. B. The cerebral hemodynamic response to the xanthine compound, paraphyllin (diethyl-aminoethyl theophylline hydrochloride). Amer. Heart J., 1954, 47:912-918.
Ogata, M. Variations of the cerebral temperature in cats under ordinary living conditions. Kyushu J. Med. Sci., 1959, 10:61-79.
Patterson, J. L., Heyman, A., and Nichols, F. T. Cerebral blood flow and oxygen consumption in neurosyphilis. J. Clin. Invest., 1950, 29:1327-1334.
Rechtschaffen, A., Verdone, P., and Wheaton, J. Reports of mental activity during sleep. Canad. Psychiat. Ass. J., 1963, 8:409-414.
Rechtschaffen, A., Cornwell, P., and Zimmerman, W. Brain temperature variations with paradoxical sleep in the cat. Paper read at Ass. for Psychophysiological Study of Sleep, Washington, D. C., March 1965.
Rechtschaffen, A. and Foulkes, D. Effect of visual stimuli on dream content. Percept. Mot. Skills, 1965, 20:1149-1160.
Scheinberg, P. and Stead, E. A. The cerebral blood flow in male subjects as measured by the nitrous oxide technique. Normal values for blood flow oxygen utilization, glucose utilization, and peripheral resistance with observations on the effect of tilting and anxiety. J. Clin. Invest., 1949, 28:1163-1171.
Scheinberg, P. Cerebral circulation and metabolism in hyperthyroidism. J. Clin. Invest., 1950, 29:1010-1013.
Schmidt, C. F., Kety, S. S., and Pennes, H. H. The gaseous metabolism of the brain of the monkey. Am. J. Physiol., 1945, 143:33-52.
Sensenbach, W., Madison, L., and Ochs, L. A comparison of the effects of l-norepinephrine, synthetic l-epinephrine, and U.S.P. epinephrine upon cerebral blood flow and metabolism in man. J. Clin. Invest., 1953, 32:226-232.
Serota, H. M. and Gerard, R. W. Localized thermal changes in the cat's brain. J. Neurophysiol., 1938, 1:115-124.
Serota, H. M. Temperature changes in the cortex and hypothalamus during sleep. J. Neurophysiol., 1939, 2:42-47.
Shapot, V. S. Brain metabolism in relation to the functional state of the central nervous system. In D. Richter (Ed.), Metabolism of the nervous system. New York: Permagon, 1957. Pp. 257-262.
Shenkin, H. A., Spitz, E. B., Grant, F. C., and Kety, S. S. The acute effects on the cerebral circulation of the reduction of increased intracranial pressure by means of intravenous glucose or ventricular drainage. J. Neurosurg., 1948, 5:466-470.
Shenkin, H. A. Effects of various drugs upon cerebral circulation and metabolism of man. J. Appl. Physiol., 1951, 3:465-471.
Shenkin, H. A., Cabieses, F., van den Noordt, G., Sayers, P., and Cooperman, R. The hemodynamic effect of unilateral carotid ligation on the cerebral circulation of man. J. Neurosurg., 1951, 8:38-45.
Sigman, E., Kolin, A., Katz, L., and Jochim, K. Effect of motion on the electrical conductivity of the blood. Am. J. Physiol., 1937, 118:708-719.
Sokoloff, L., Mangold, R., Wechsler, R. L., Kennedy, C., and Kety, S. S. The effect of mental arithmetic on cerebral circulation and metabolism. J. Clin. Invest., 1955, 34:1101-1108.
Sokoloff, L. Relation of cerebral circulation and metabolism to mental activity. In S. R. Korey and J. I. Nurnberger (Eds.), Neurochemistry. New York: Hoeber and Harper, 1956, Pp. 216-229.
Sokoloff, L., Perlin, S., Kornetsky, C., and Kety, S. S. The effects of d-lysergic acid diethylamide on cerebral circulation and overall metabolism. Ann. N.Y. Acad. Sci., 1957, 66:468-477.
Sokoloff, L. The action of drugs on the cerebral circulation. Pharmacol. Rev., 1959, 11:1-85.
Sugano, H. and Inanaga, K. Studies on the localized cerebral blood flow. Kyushu J. Med. Sci., 1961, 12:9-13.
Wechsler, R. L., Kleiss, L. M., and Kety, S. S. The effects of intravenously administered aminophylline on cerebral circulation and metabolism in man. J. Clin. Invest., 1950, 29:28-30.
Wechsler, R. L. Effects of cigarette smoking and intravenous nicotine on the human brain. Fed. Proc., 1958, 17:169.
Wikler, A. Pharmacologic dissociation of behavior and EEG "sleep patterns" in dogs: Morphine, N-allylnormorphine, and atropine. Proc. Soc. Exp. Biol. Med., 1952, 79:261-265.
 Go back to the Dream Library index. Go back to the Dream Library index.
|